
(Difference between revisions)
| Revision as of 13:03, 15 June 2006 Peter (Talk | contribs) (→'''Two basic modelling options''') ← Previous diff |
Current revision Peter (Talk | contribs) |
||
| Line 1: | Line 1: | ||
| <blockquote> | <blockquote> | ||
| - | ='''Two basic modelling options'''= | + | __NOTOC__ |
| + | ==2.1. The two basic modelling options: grid-based and station-based== | ||
| + | ------------------------------------ | ||
| + | {| style="background-color:#F5F5F5; border-collapse:collapse" cellspacing="7" border="1" bordercolorlight="#0000FF" bordercolordark="#0000FF"> | ||
| + | |style="border-style: solid; border-width: 1px"|''Peter Hoefsloot, René Gommes'' | ||
| + | |- | ||
| + | |} | ||
| - | A crop monitoring program has to be based on data from different locations inside the country of region that needs to be monitored. | + | ==Two basic modelling options== |
| - | Technically these monitoring locations are points. Points can be pinpointed at the earth’s surface with coordinates. The coordinate system that is used in crop forecasting is called a geographic coordinate system whereby the coordinates are expressed in Longitude - Latitude pairs. | + | A crop monitoring program has to be based on data from different locations inside the country or region that needs to be monitored. Technically these monitoring locations are points. Points can be pinpointed at the earth’s surface with coordinates. The coordinate system that is used in crop forecasting is called a geographic coordinate system whereby the coordinates are expressed in Longitude - Latitude pairs. |
| Example : the geographic coordinates of Pnom Penn (Cambodia) are: | Example : the geographic coordinates of Pnom Penn (Cambodia) are: | ||
| Line 12: | Line 18: | ||
| Depending on the circumstances, the crop forecasting network can be based on: | Depending on the circumstances, the crop forecasting network can be based on: | ||
| - | [[Image:graph5.jpg|thumb|'''Modelling type 1. Rainfall stations in Africa'''|400px|right]] | + | * An irregularly spaced network based on agrometeorological stations |
| - | * An '''irregularly spaced network based on real-world stations''' (''Modelling type 1''). As an example below part of the rainfall recording stations in Africa. This type of network has a preference over the second type whenever station data (to run the water balance) are available. The main advantages of this type of monitoring network are: | + | * A regularly spaced grid |
| - | ** Input and output of the water balance model can be checked against the real situation in the field. | + | |
| - | ** Station weather data are more accurate than gridded data in the vicinity of the stations themselves. | + | |
| - | ** Usually requires less computer power due to lower number of monitoring points. | + | |
| - | : Although the water balance is calculated on a irregularly spaced network, output data can be transformed into grids or images using interpolation techniques. This enables the estimation of water balance parameters for all corners of the monitoring area. | + | |
| - | * A '''regularly spaced grid''' (''Modelling type 2''). In this case, grid points do not coincide with meteorological stations. This type of monitoring network is particularly useful if ground data are scarce or inaccurate and weather data with sufficient accuracy are available on a grid or image basis. | + | |
| - | [[Image:graph6.jpg|thumb|'''Modelling type 2. Grid example for Afghanistan (0.5 degree distance)'''|400px|right]] | + | |
| + | === An irregularly spaced network based on agrometeorological stations === | ||
| + | An example of such a network is shown below. The picture depicts rainfall recording stations in Africa. The main advantages of this type of monitoring network are: | ||
| + | * Input and output of the water balance model can be checked against the situation in the field. | ||
| + | * Station weather data are more accurate than gridded data, certainly in the vicinity of the stations themselves. | ||
| + | * Usually requires less computer power due to lower number of monitoring points. | ||
| + | * Although the water balance output of an irregularly spaced network is irregularly spaced as well, these data can be transformed into grids or images using interpolation techniques. This enables the estimation of water balance parameters for all parts of the monitoring area. | ||
| + | <blockquote> | ||
| + | {|"class=prettytable" cellpadding="15" border="1" style="border-collapse:collapse" | ||
| + | |width="225"|'''Monitoring stations in Africa||[[Image:graph5.jpg|400px|]] | ||
| + | |} | ||
| + | </blockquote> | ||
| + | ===A regularly spaced grid=== | ||
| + | In this type of network, grid points do not coincide with meteorological stations. It is particularly useful when ground data are scarce or inaccurate and weather data with sufficient accuracy are available on a grid or image basis. The advantages of this type of modeling approach are: | ||
| + | * Complete coverage of the country/region is possible. | ||
| + | * Data are relatively easy to get. | ||
| + | * Input and output are easily visualized. | ||
| - | Within the crop forecasting tools these locations are | + | <blockquote> |
| + | {|"class=prettytable" cellpadding="15" border="1" style="border-collapse:collapse" | ||
| + | |width="225"|'''Grid example for Afghanistan (0.5 degree distance)'''||[[Image:graph6.jpg|400px|]] | ||
| + | |} | ||
| + | </blockquote> | ||
| - | When setting up a crop monitoring program two basic approaches exist | + | '''Example of worldwide weather grid data availability'''. Meteorological data with a worldwide extend are offered by the MARS FOOD (European Union) based on outputs of the ECMWF (European Centre for Medium-Range Weather Forecast) atmospherical model. A time series for more than 40 years is now available thanks to the ERA40 reanalysis project. The data can be downloaded in ASCII Grid format. Get the data [http://agrifish.jrc.it/marsfood/ecmwf.htm here]. A tool is available to convert the grids into IDA images. This tool (JRC2IDA) can be downloaded here: [http://www.hoefsloot.com/Downloads/jrc2ida_install.exe here]. |
| + | <blockquote> | ||
| + | {| border="1" | ||
| + | |- | ||
| + | | '''Data available from MARS FOOD web site''' | ||
| + | |- | ||
| + | | average temperature | ||
| + | |- | ||
| + | | maximum temperature | ||
| + | |- | ||
| + | | minimum temperature | ||
| + | |- | ||
| + | | precipitation sum | ||
| + | |- | ||
| + | | evapo-transpiration sum (ES0, bare soil) | ||
| + | |- | ||
| + | | evapo-transpiration sum (E0, over water) | ||
| + | |- | ||
| + | | evapo-transpiration sum (ET0, Penman-Monteith) | ||
| + | |- | ||
| + | | global radiation sum | ||
| + | |}</blockquote> | ||
| + | ===Which type is best?=== | ||
| - | gridding before modelling, and modelling before gridding. Advantages and disadvantages in terms of errors, labour and accuracy of forecasts. | + | Many (sometimes heated) debates have been devoted to which modelling type is best. In many areas it is virtually impossible to work with measured weather data on a near real-time basis (although the real-time WMO GTS network for weather data might be an additional source of data). In some areas, given the timely availability of measured data makes the measured data difficult to ignore. Gaps in measured values can sometimes be filled with gridded data. |
| + | |||
| + | A simple rule of thumb could be that whenever good ground data are available, the irregularly spaced network type has a preference over a gridded network. | ||
| + | |||
| </blockquote> | </blockquote> | ||
Current revision
[edit]2.1. The two basic modelling options: grid-based and station-based
Peter Hoefsloot, René Gommes [edit]Two basic modelling options
A crop monitoring program has to be based on data from different locations inside the country or region that needs to be monitored. Technically these monitoring locations are points. Points can be pinpointed at the earth’s surface with coordinates. The coordinate system that is used in crop forecasting is called a geographic coordinate system whereby the coordinates are expressed in Longitude - Latitude pairs.
Example : the geographic coordinates of Pnom Penn (Cambodia) are:
- Longitude: 104.917445
- Latitude : 11.558831
Normally expressed as 104.917445, 11.558831 (longitude always first). Read more: Geographic Coordinates
Depending on the circumstances, the crop forecasting network can be based on:
- An irregularly spaced network based on agrometeorological stations
- A regularly spaced grid
[edit]An irregularly spaced network based on agrometeorological stations
An example of such a network is shown below. The picture depicts rainfall recording stations in Africa. The main advantages of this type of monitoring network are:
- Input and output of the water balance model can be checked against the situation in the field.
- Station weather data are more accurate than gridded data, certainly in the vicinity of the stations themselves.
- Usually requires less computer power due to lower number of monitoring points.
- Although the water balance output of an irregularly spaced network is irregularly spaced as well, these data can be transformed into grids or images using interpolation techniques. This enables the estimation of water balance parameters for all parts of the monitoring area.
Monitoring stations in Africa 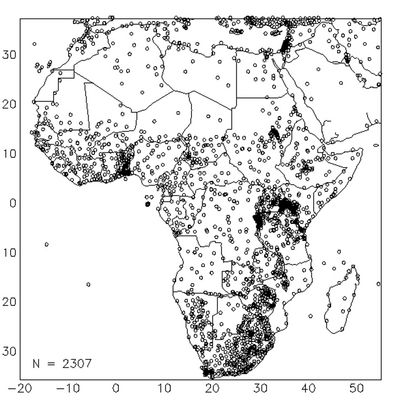 [edit]
A regularly spaced grid
In this type of network, grid points do not coincide with meteorological stations. It is particularly useful when ground data are scarce or inaccurate and weather data with sufficient accuracy are available on a grid or image basis. The advantages of this type of modeling approach are:
- Complete coverage of the country/region is possible.
- Data are relatively easy to get.
- Input and output are easily visualized.
Grid example for Afghanistan (0.5 degree distance) 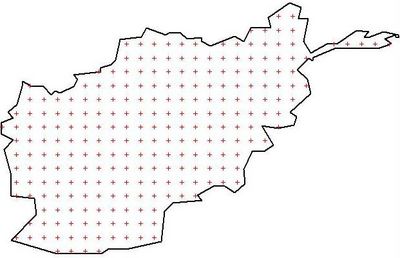
Example of worldwide weather grid data availability. Meteorological data with a worldwide extend are offered by the MARS FOOD (European Union) based on outputs of the ECMWF (European Centre for Medium-Range Weather Forecast) atmospherical model. A time series for more than 40 years is now available thanks to the ERA40 reanalysis project. The data can be downloaded in ASCII Grid format. Get the data here. A tool is available to convert the grids into IDA images. This tool (JRC2IDA) can be downloaded here: here.
Data available from MARS FOOD web site average temperature maximum temperature minimum temperature precipitation sum evapo-transpiration sum (ES0, bare soil) evapo-transpiration sum (E0, over water) evapo-transpiration sum (ET0, Penman-Monteith) global radiation sum [edit]Which type is best?
Many (sometimes heated) debates have been devoted to which modelling type is best. In many areas it is virtually impossible to work with measured weather data on a near real-time basis (although the real-time WMO GTS network for weather data might be an additional source of data). In some areas, given the timely availability of measured data makes the measured data difficult to ignore. Gaps in measured values can sometimes be filled with gridded data.
A simple rule of thumb could be that whenever good ground data are available, the irregularly spaced network type has a preference over a gridded network.

