
(Difference between revisions)
| Revision as of 08:08, 18 August 2006 Peter (Talk | contribs) (→''' Entering weather data from images''') ← Previous diff |
Current revision Peter (Talk | contribs) |
||
| Line 1: | Line 1: | ||
| <blockquote> | <blockquote> | ||
| - | ='''Entering and importing weather and crop data.'''= | + | __NOTOC__ |
| + | ==3.1. Entering and importing normal and actual weather data. == | ||
| + | ------------------------------------ | ||
| + | {| style="background-color:#F5F5F5; border-collapse:collapse" cellspacing="7" border="1" bordercolorlight="#0000FF" bordercolordark="#0000FF"> | ||
| + | |style="border-style: solid; border-width: 1px"|''Peter Hoefsloot'' | ||
| + | |- | ||
| + | |} | ||
| - | After a network has been created, crop data can be entered by hand. In principle this is possible for grid-based networks and station networks alike. However as grid-based networks do not coincide with a ground network, it will usually not make sense to enter data manually. | + | Once a network has been created, data for the network can be entered by hand. This is possible for grid-based networks and station networks alike. However, as grid-based networks do not coincide with a ground network, it will usually not make sense to enter data manually for that type of network. The data are stored in the Microsoft Access database that is maintained by AgrometShell. The name and path of this database can be seen in the top bar of AgroMetShell. Entering data is done in three ways: |
| + | * Manually | ||
| + | * Importing from images | ||
| + | * Importing from tabular ASCII data. | ||
| + | All three methods are explained below. | ||
| - | =''' Entering weather data manually'''= | + | === Option1: Entering weather data manually=== |
| - | As the FAO water balance model is usually run with a 10-day (dekadal) time step, this example will show how to enter dekadal data. | + | As the FAO water balance model is usually run with a 10-day (dekadal) time step, this example will show how to enter dekadal weather data. |
| Line 13: | Line 23: | ||
| |width="300"|New rainfall data will be entered for 2006. The filter at the top part of the screen is applied to reflect this.||[[Image:graph32.jpg|400px|]] | |width="300"|New rainfall data will be entered for 2006. The filter at the top part of the screen is applied to reflect this.||[[Image:graph32.jpg|400px|]] | ||
| |---- | |---- | ||
| - | |width="300"|A new record of data (36 dekadal values for a year) can be entered after pressing the + sign in the toolbar at the top of the screen. In the next window, the station name can be entered.||[[Image:grap33.jpg|400px|]] | + | |width="300"|A new record of data (36 dekadal values for a year) can be entered after clicking the + sign in the toolbar at the top of the screen. In the window, the station name can be entered. Due to the applied filter, the parameter and year cannot be entered.||[[Image:grap33.jpg|400px|]] |
| |---- | |---- | ||
| - | |width="300"|Data are entered directly into the window. Flags could be specified as well, although one is not obliged to do so. ||[[Image:grap34.jpg|400px|]] | + | |width="300"|Data are entered directly into the window. If needed, flags can be entered. ||[[Image:grap34.jpg|400px|]] |
| |} | |} | ||
| - | All weather data for all time periods (daily, decadal and monthly data) can be entered in the same way. | + | All weather data for all time periods (daily, decadal and monthly data) can be entered in the same way. The same applies to normal data. |
| - | =''' Entering weather data from images'''= | + | === Option 2: Entering weather data from images=== |
| - | Weather data derived from satellite imagery are getting better every year. The satellite imagery record that has been built up from the nineteen seventies now enables the calculation of normals as well. Although satellite derived data cannot be a substitute for ground data, these data are often the only possibility to run a water balance model, due to lack of ground data. | + | Weather data derived from satellite imagery are improving every year. The satellite imagery history that has been built up from the eighties now enables the calculation of normals as well. Although satellite derived data cannot be a substitute for ground data, these data are often the only available data. |
| - | + | These satellite-derived data can be used in AgrometShell (for example in a water balance calculation) after importing them. This can be achieved in the following way: | |
| - | These satellite-derived data can be used in AgrometShell after importing them. This can be done in the following way: | + | |
| {|"class=prettytable" cellpadding="15" border="1" style="border-collapse:collapse" | {|"class=prettytable" cellpadding="15" border="1" style="border-collapse:collapse" | ||
| Line 35: | Line 44: | ||
| |} | |} | ||
| - | The same function can also be used to import altitude data from a Digital Terrain Model (DTM). | + | The same function can also be used to import station altitude data from a Digital Terrain Model (DTM). |
| - | =''' Entering weather data from ASCII files'''= | + | ===Option 3: Importing tabular weather data from ASCII files=== |
| + | In many circumstances data come in a digitized tabular form (ASCII). It would be a long and error-prone procedure to enter these data manually into Agrometshell. Therefore an import module exist that is described [[ASCIIDataImport|here]]. | ||
| + | ----------- | ||
| Line 50: | Line 61: | ||
| - | </blockquote> | ||
| - | ----------- | + | |
| + | </blockquote> | ||
Current revision
[edit]3.1. Entering and importing normal and actual weather data.
Peter Hoefsloot Once a network has been created, data for the network can be entered by hand. This is possible for grid-based networks and station networks alike. However, as grid-based networks do not coincide with a ground network, it will usually not make sense to enter data manually for that type of network. The data are stored in the Microsoft Access database that is maintained by AgrometShell. The name and path of this database can be seen in the top bar of AgroMetShell. Entering data is done in three ways:
- Manually
- Importing from images
- Importing from tabular ASCII data.
All three methods are explained below.
[edit]Option1: Entering weather data manually
As the FAO water balance model is usually run with a 10-day (dekadal) time step, this example will show how to enter dekadal weather data.
Activate the Database - Manage Weather Data - Dekad function. In this example data for Bangladesh will be entered. 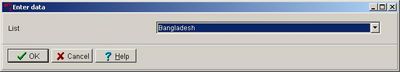
New rainfall data will be entered for 2006. The filter at the top part of the screen is applied to reflect this. 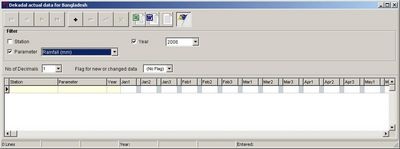
A new record of data (36 dekadal values for a year) can be entered after clicking the + sign in the toolbar at the top of the screen. In the window, the station name can be entered. Due to the applied filter, the parameter and year cannot be entered. 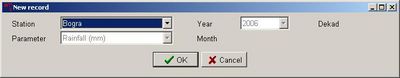
Data are entered directly into the window. If needed, flags can be entered. 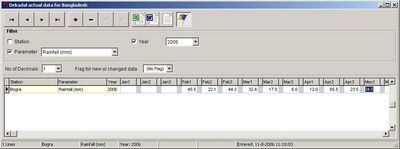
All weather data for all time periods (daily, decadal and monthly data) can be entered in the same way. The same applies to normal data.
[edit]Option 2: Entering weather data from images
Weather data derived from satellite imagery are improving every year. The satellite imagery history that has been built up from the eighties now enables the calculation of normals as well. Although satellite derived data cannot be a substitute for ground data, these data are often the only available data.
These satellite-derived data can be used in AgrometShell (for example in a water balance calculation) after importing them. This can be achieved in the following way:
Activate the Database - Import – from image function. In this example data for Niger will be imported from a Sahelwide image. 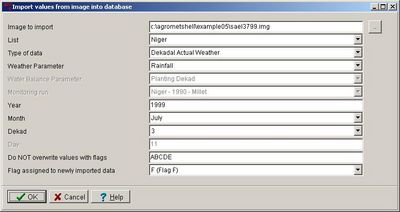
The new data will be extracted from the image. To check whether the data have been imported, use the Data – Inventory function. 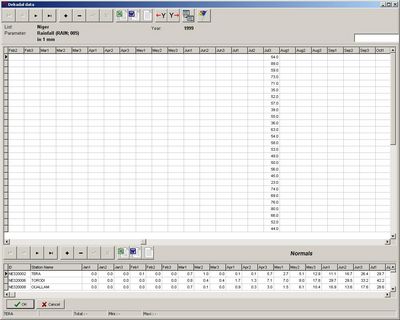
The same function can also be used to import station altitude data from a Digital Terrain Model (DTM).
[edit]Option 3: Importing tabular weather data from ASCII files
In many circumstances data come in a digitized tabular form (ASCII). It would be a long and error-prone procedure to enter these data manually into Agrometshell. Therefore an import module exist that is described here.


