[edit]3.3. Preparing and using the dekadal rainfall and ET0 database for crop monitoring
Peter Hoefsloot Crop forecasting based on water balance calculations is usually done in a ten-day timestep. A ten day period is called a “dekad”. Should daily weather data of good spatial and temporal extend be available, the water balance can be run in AgrometShell on a daily basis.
In order to do crop forecasting the following weather data have to be gathered:
- Actual decadal rainfall data for the running season.
- Actual decadal ET0 data for the running season
- Normal rainfall data
- Normal ET0 data
The previous chapter has shown how a database of weather data can be established.
[edit]Weather data as indicators
Weather data form simple indicators in itself, even without using them directly in a water balance calculation. Some examples are given below:
[edit]Example 1: Preparing a simple rainfall map for the current dekad
Start the “Database-Map” function. This example will display rainfall data for the first dekad of May in 2002 for Bangladesh. 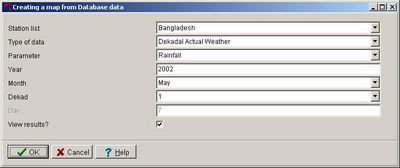
With the world map as default, some cluttered data are shown for Bangladesh 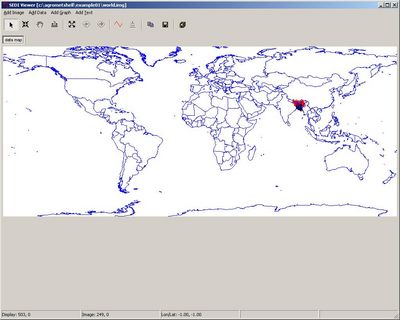
Applying the zoom buttons results in an image for Bangladesh. With the Copy-to-clipboard button this image can be copied to the clipboard and pasted into a word processor. 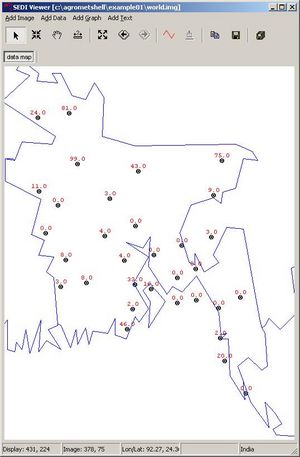
[edit]Example 2: Calculating accumulated rainfall from the beginning of the season
Microsoft Excel is needed to do the accumulation. Therefore the data are exported to Excel.
In this example the accumulated rainfall for the season 1991-1992 is calculated. The example is for Zimbabwe where the season starts around November. The current dekad is assumed to be the second dekad of March 1992. Start the “Database-Export’’ function. Start a new export format 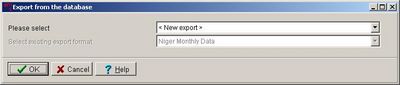
A list containing Zimbabwean stations is selected. 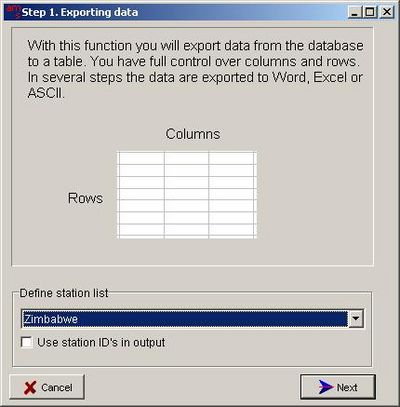
All stations in the list are presented. Now add columns with the ‘’Add’’ button. 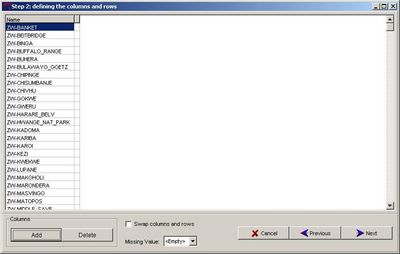
Specify the meteorological parameter to export (Rainfall). In this example 3 columns are exported added at the same time. 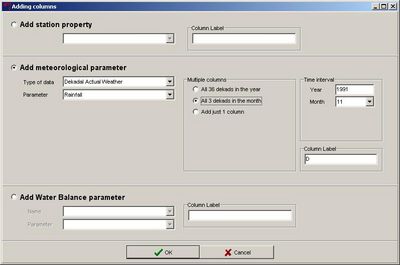
The same is done for all dekads until the current one (Dekad 2 of March 1992). When ready press ‘’Next’’ 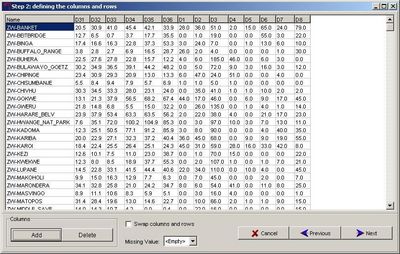
Select Export to Excel 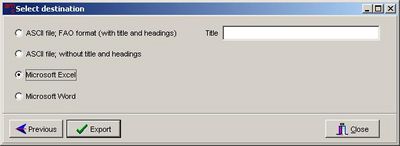
All data are presented in Excel 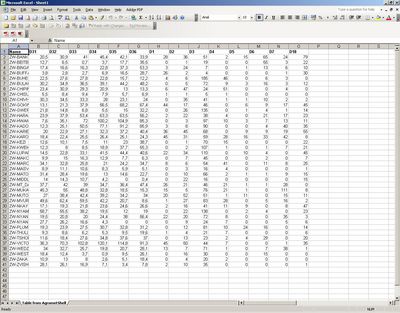
The totals are calculated using Excel formulas. 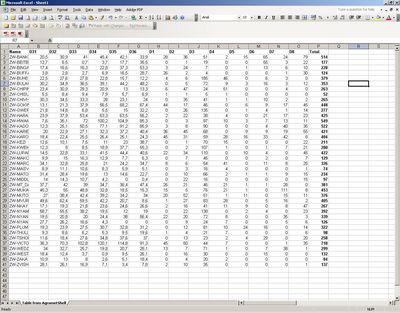
[edit]Example 3: An accumulated rainfall image
By applying interpolation to the total rainfall amounts calculated in the previous step, an image is created.
In Excel the totals file has to be reformatted to a CSV file. This CSV file should have the column order (1)longitude (2)latitude (3)value (4)station name 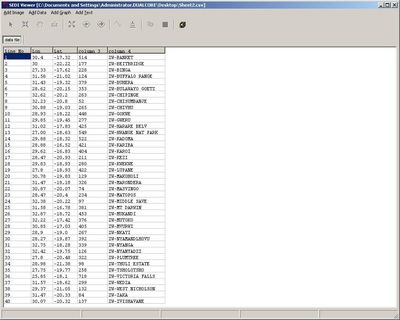
Using the Interpolate-Inverse Distance function, the CSV file can be interpolated to an image. 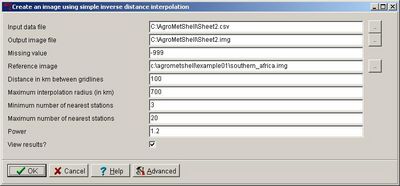
The result is an image. This provides a much more visual picture of the cumulative rainfall. 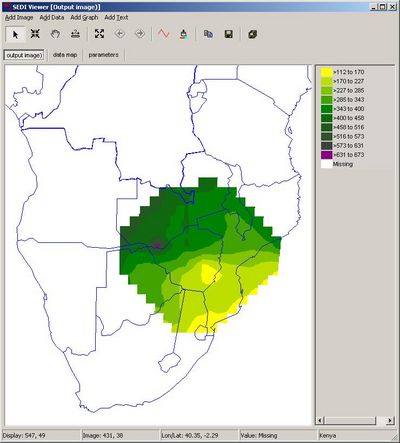
[edit]Example 4: An improved accumulated rainfall image (using SEDI with altitude)
The image in the previous paragraph can be improved with the application of a DTM. The DTM (altitude) constitutes a background factor that helps the interpolation. The assumption is that the higher the altitude, the higher the rainfall.
Apply the Interpolate – SEDI - Inverse Distance function with the settings shown 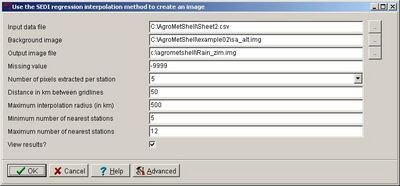
The resulting image. The accuracy of the method can be calculated by leaving a number of data points (stations) out and examine the differences between the measured and interpolated values. 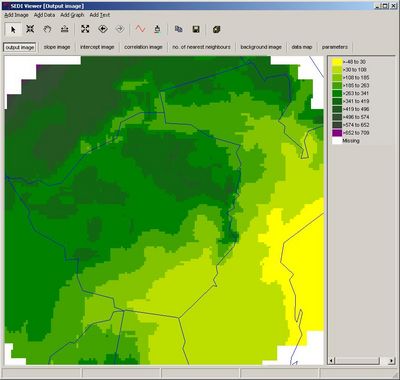

| CM Box User Guide | Main Page | About | Special pages | Log in |
Printable version | Disclaimer | Privacy policy |


