[edit]6.3. Running the Water Balance Model. Understanding the output of the model.
René Gommes, Peter Hoefsloot
[edit]Running the water balance
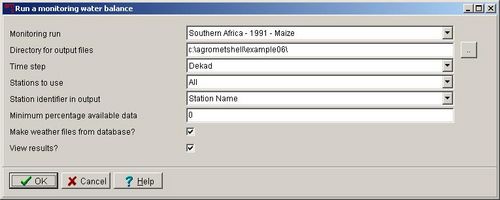
Once the input parameters have been properly defined, running the water balance is done through the Water Balance-Monitoring Run-Run function.
The user needs to define:
- The name of the monitoring run
- The directory where the output files (7) are stored
- The time step (day or dekad). Input data should match that choice.
- The stations to use. If <Select manually> is chosen, then the user will get a list of stations of which to pick the appropriate ones.
- The station identifier (ID or name)
- The minimum percentage of data available. If the availability percentage of data is too low, the function station will be excluded.
- Make weather files. In case the input waether files have already been produced from the database, the step of re-making weather files can be skipped.
- Whether the results are displayed in the AMS viewer.
Presuming all goes well, the program will start calculating and the user sees the water balances being calculated one by one. 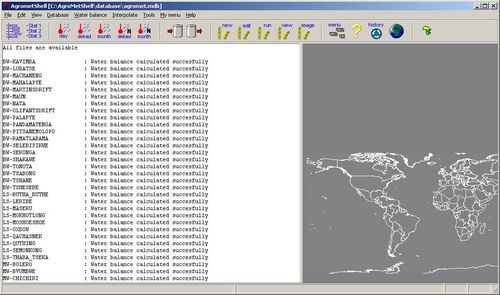 [edit]
Understanding Water Balance Output
[edit]Examining the water balance output information generated.
When the water balance calculations have finished, 5 output screens are presented. All 5 are explained below.
Summary information per station.
This window contains the summary output. In this example the output is for a maize crop at the station Kavimba in Botswana. The cycle length of the crop is 12 dekads. The total water requirement (both normal and actual) is 519 mm. The planting dekad is 34 (first dekad of December 1991. No irrigation is applied, but it case it would, the bund height of 75 mm would allow 75 mm of water on top of the field. The crop coefficient of the bare soil at the start of the season is 0.19.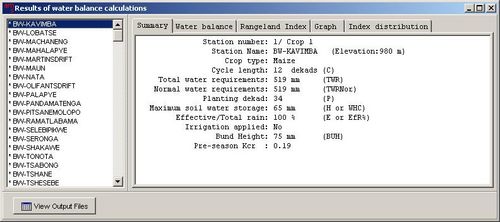
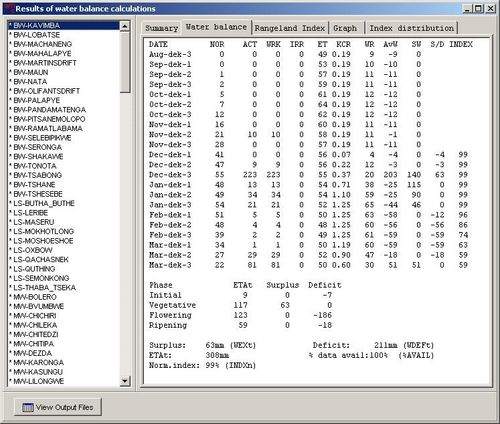
Water Balance details per station.
This is the detailed output of the water balance for a station. Calculated parameters which are calculated: the total water requirements, surplus water, water deficit, the FAO water satisfaction index and, most important, the actual evapotranspiration ETA. These values are aggregated to crop phenological stage at the bottom. The "normal index" (last line) is the water satisfaction index which would be obtained under average conditions of rainfall and ETP, all other input parameters remaining equal (planting date, % effective rain...). The other variables (columns) have the following meaning:
- NOR: the normal rainfall for the dekad (mm);
- ACT: the actual rainfall for that dekad and season (mm);
- WRK: the working rain.
- PET: (actual or normal, depending on which is available)
- KCR: the crop coefficient as calculated by the programme;
- WR: the water requirements in mm, the product of PET and KCR;
- AvW: the water available to the crop (WRK-WR), mm;
- SW: the soil moisture at the end of the dekad (mm);
- S/D: the water surplus or deficit (positive: surplus; negative: deficit).
- INDEX: the water satisfaction index.
Rangeland index per station.
The Rangeland-index is the classic FAO water satisfaction index computed for periods of 5 dekads, with average evapotranspiration kept at potential level (KCR=1) and an assumed WHC of 50 mm. Similar to moving averages, the value assigned to a dekad corresponds to the five-dekad period centred about that dekad. Thus 3 for dekads 1 to 5, 4 for dekads 2 to 6... The rangeland index, when plotted over time, assumes a smoothed aspect and is associated with crop phenology. Based on local experience, there is usually a rather good association between planting and the RI. For instance, in Tanzania, it was found that the planting of millet usually occurs when the rising RI curve crosses the 0.4 (40%) threshold. The RI is computed using actual rain. The crossing dates based on normal data are also given. They are a convenient tool to decide if the current season is early or late. Also note that more than one crossing at the low levels (30 or 40%) usually indicates a false start of the rains.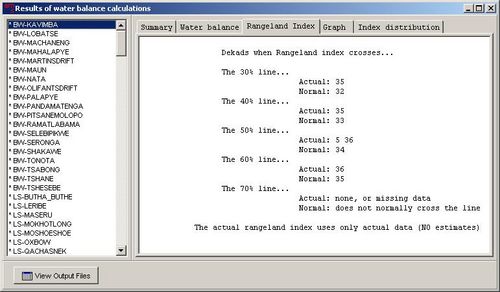
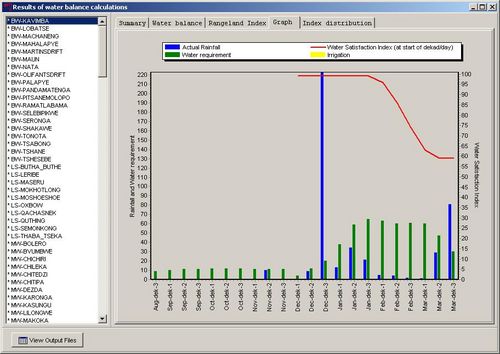
Graph for one station.
A number of parameters shown in the previous tabs are represented graphically in this window. The parameters are:
- The actual rainfall for that dekad and season (mm);
- The water requirements in mm, the product of PET and KCR;
- The water satisfaction index.
- Irrigation. Is this case, no irrigation is applied.
Index distribution for all stations.
This graph gives an overview of the final index for all stations. In this case many stations have an index of 100% (no water stress).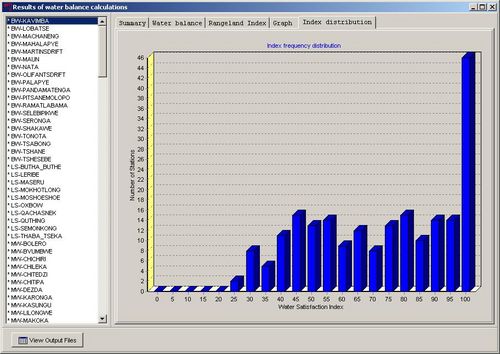 [edit]
Examining the detailed output files.
All output is written to 7 files, of which the first is in a plain text format. It can be read with any editor or word-processor and be easily printed.
The files can be accessed through the ‘View Output files’ button on the examination screen 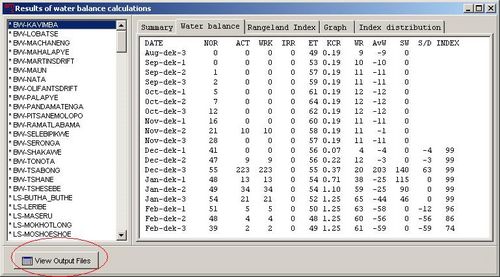
[edit]A description of all output files.
1. File <Run-Name>_<Start-Year>_Details_<Time-step>_Output.txt
The text output file contains details of the water balance calculations, station by station and dekad by dekad and is outlined above.The other output files are in FAO format structure. They all contain the following variables, next to the station name:
- Id, the crop identification number (see 3.1 above: maize=1,... ETP=8). ETP is a "dummy" crop with no phenology (the crop coefficient stays permanently at 1.0);
- X, Y, Z are longitude, latitude, and elevation. As these parameters are given for reference only (they enter no calculations) they can be given as "missing" in the input files without any problem to FAOINDEX. But they will probably be needed in the further processing of the files and, therefore, it is good practice to use correct values.
The additional variables which occur in each of the output files are described hereunder together with the description of files (2) to (7).
2. File <Run-Name>_<Start-Year>_Summary_<Time-step>_Output.dat
The summary output file lists the parameters which are likely to be used for further processing and analysis, in particular for crop forecasting. The remaining files are more "monitoring-oriented" as they contain sequences of several dekad values for display and inter-station comparisons. The variables listed in the summary are the following:
- H and WHCi, the soil Water Holding Capacity, and its initial value, respectively;
- E and EfR%, the ratio between effective and actual total and rain, in percent;
- P, the planting dekad (1-36);
- C, the length of the crop cycle (dekads);
- TWR, total water requirements in mm;
- Indx, IndxNor and IndxLast, FAO soil water satisfaction index, in % of requirements, respectively actual, average and "last" values. Actual corresponds to the value expected at the end of the cycle, average is the end-of-cycle index computed with average rain and PET, all other parameters being those from the crop file; the "last" value is that of the last dekad for which actual data are available ();
- EXWT and DEFWT: excess and deficit water totalled over the growing cycle;
- ETA: actual crop evapotranspiration (i.e. actual crop water consumption), a factor directly related with crop yield;
- %Av, ("available") the percentage of actual rainfall data used for the calculations (the rest being assumed to be average)
- Cr1 to Cr4 and Ncr1 to NCR4 (for "Crossing" and "Normal Crossing") indicate the dates (dekads) when the rangeland index (see (7) below) crosses the 0.4*PET line. The dekads given in the file can be used to map the beginning of the actual (current) season (Cr1 to Cr4) and the normal beginning (NCr1 to NCr4). In areas with only one rainfall peak, there is only one normal start, but there are two in bimodal rainfall areas. In marginal areas, where rainfall is very close to 40% of PET, there may be more than one start even in areas with unimodal rainfall. The actual starts may be more than the normal starts, particularly in the not so rare event of false starts when rain decreases again after a first start: in the field, farmers must frequently replant when this happens.
3. File <Run-Name>_<Start-Year>_WaterStorage_<Time-step>_Output.dat
This file contains the soil water data, computed for each dekad, in the rows of the file. Note that dekads are crop dekads (from 1 to cycle length). Values beyond cycle length are coded with the default value for missing data. D1,D2...D36 are the dekad numbers in crop dekads (i.e. planting dekad is 1 and the last values corresponds to C, the cycle length).4. File <Run-Name>_<Start-Year>_ActualPET_<Time-step>_Output.dat
This file has the same structure as file (3); it contains the estimated crop actual evapotranspiration for each dekad.5. File <Run-Name>_<Start-Year>_WaterSatisfactionIndex_<Time-step>_Output.dat
This file lists the values of the FAO water satisfaction index.6. File <Run-Name>_<Start-Year>_WaterSurplusDeficit_<Time-step>_Output.dat
This file contains the Water surplus in mm (positive values) and deficits in mm (negative) constitute one of the methods to assess visually periods of drought or water logging7. File <Run-Name>_<Start-Year>_RangelandIndex_<Time-step>_Output.dat
The "rangeland-index" is the classic FAO water satisfaction index computed for periods of 5 dekads, with average evapotranspiration kept at potential level (KCR=1) and an assumed WHC of 50 mm.

| CM Box User Guide | Main Page | About | Special pages | Log in |
Printable version | Disclaimer | Privacy policy |


