[edit]8.1. Examples of other weather based indicators
René Gommes, Peter Hoefsloot
Besides the FAO water balance method, there are many other useful analysis methods used in crop forecasting. The following functions (supported by the CM Box) are discussed here.
- Calculating the length of the growing period
- Use Gamma distribution to calculate Rainfall Probabilities.
[edit]1. Calculating the Length of the Growing Period (LGP)
The length of the growing period (LGP), as defined by the Agro-Ecological Zones project carried out at FAO during the last two decades [refs], is the period (in days) during a year when precipitation exceeds half the potential evapotranspiration, plus a period required to evapotranspire an assumed 100 mm of water from excess precipitation stored in the soil profile.
The LGP is a useful concept for calculating agricultural potential, and can be used as a criterion for classifying areas and in roughly determining crop cycle lengths. The calculation of the growing period is based on a simple water balance model, comparing precipitation with PET, using monthly values. A "normal" growing period has the following characteristics:
- A Beginning. The beginning coincides with the start of the normal rainy season and is taken as the date when precipitation equals half PET, denoted as a in the figure below. A value of 1/2 PET has been chosen because the water requirements of germinating crops are much below the full rate of PET, reflected clearly in the magnitude of the crop coefficients, and false starts to the rainy season are eliminated.
- A Humid Period. This is the period during which precipitation exceeds PET. The beginning and ending dates are the two points where the precipitation and PET curves cross. During this period, crops are able to meet their full water requirements and the soil moisture deficit is replenished. The ending date of the humid period coincides with the end of the rainy season and crops mature largely from water stored in the soil.
- An End to the Growing Period. This occurs at the point where the precipitation curve crosses the 1/2 PET curve (labeled as d in the figure below) and takes into consideration that most crops continue to grow beyond the end of the rainy season. The soil water-holding capacity is assumed to be 100 mm and the time taken to deplete the remaining soil reserves at the end of the season is added on to the LGP.
Schematic presentation of growing period types 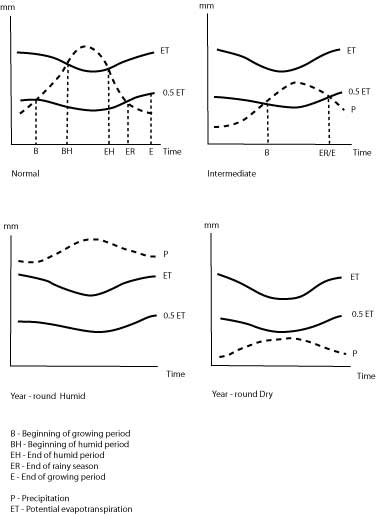
In addition to a normal period, three other types of growing periods can be defined:
- Intermediate Growing Period. Throughout the year, the average monthly precipitation does not exceed the full rate of the average monthly PET, but it does exceed half the PET. The beginning and the end of such an intermediate growing period are defined as the points where the precipitation curve crosses the 0.5 PET curve and there is no humid period.
- All Year Round Humid Growing Period. The average monthly pptn, for every month of the year, exceeds the full rate of the average monthly PET. Thus, there is no true start to the growing period or to the humid period. Areas with all year round humid growing periods have been included and inventoried as areas with a normal growing period of 365 days.
- All Year Round Dry Period. The average monthly precipitation for every month of the year is lower than half the average monthly PET. Areas with all year round dry periods have been inventoried separately as areas with a growing period of 0 days.
[edit]An example
Examine the sample data file, AL-LGP.DAT. The file contains station names in Africa, 12 monthly values of rainfall and PET for each station. Notice that the input file requires the rainfall and PET to appear on the same line. 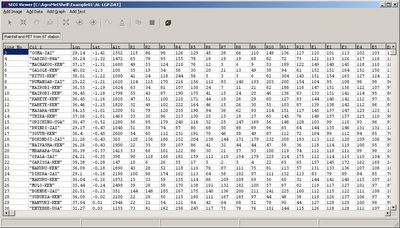
Activate the Tools - Length of growing period function. A settings window appears and among other settings, you will be prompted to accept or change the default value of 1/2 PET to define the beginning and the end of the growing season as given in the original AEZ definition. For this example, accept the value and click on the “Ok” button to perform the calculation. 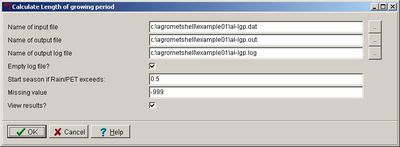
A new record of data (36 dekadal values for a year) can be entered after pressing the + sign in the toolbar at the top of the screen. In the next window, the station name can be entered. 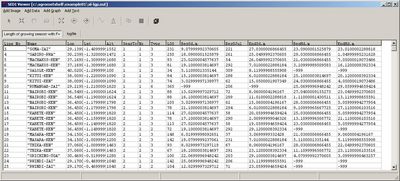
The outcome of the calculation is written to a file. The first columns contain station name, latitude, longitude, altitude and several growing season characteristics. The next table describes these parameters in the output file and the range of possible answers:
Column Heading Meaning of the column variable Range of Answers Seastot Seasonal total rainfall (mm) N.A. Nr Number of seasons 1 - single; > 1 - multiple Type Type of season 1 - dry; 2 - intermediate; 3 - normal; 6 - normal with no dry period LGS Length of the Growing Season (days) 0 to 365 BegSd.m Beginning of the season (day.month) BegSJul Beginning of the season(Julian days) 0 to 365 EndSd.m End of the season (day.month) BegHd.m Beginning of the humid period (day.month) -999 if no humid period EndHd.m End of the humid period (day.month) -999 if no humid period
Note that for a station with a year round dry period, indicated as 1 under the column "Type", the LGS will be listed as having 365 days instead of 0 days.[edit]2. Gamma distribution to calculate Rainfall Probabilities.
Rainfall is responsible for most of the year-to-year variability in crop yields in many developing countries. If the varieties used are locally-adapted, the output will be normal whenever the rains are normal, given no other limiting factors such as pests or diseases.
When working operationally with rainfall data, one is often interested in knowing whether the rainfall recorded was unusually high or low. This can only be assessed by comparing the current rainfall with historical rainfall records covering a period of many years. Take the rainfall record for Rome, which goes from 1782 to 1980, as an example. Suppose that the rainfall recorded in June 1981 was the lowest ever registered during that month. We can say that the rainfall received was exceptionally low and that rain fed crops in the field were likely to have suffered a severe water shortage, i.e., drought conditions.
A very high (or low) amount of rain that occurs, on average during a few years every century, is said to have a very low probability of occurrence. This is usually expressed as the probability of exceedence (P) of a given amount of rainfall. If P is below 5%, it means that rainfall was exceptionally high, since it will be exceeded (on average) in only 5 years out of every 100. Likewise, values above 95% correspond to exceptionally dry conditions. The probability range from 5 to 20 and from 80 to 95 is termed unusual and values from 21 to 79 are considered normal.
This option calculates rainfall probabilities based on the incomplete gamma distribution which best approximates the positively skewed rainfall distribution of tropical countries, for short periods of a month or less. By integrating the area under the curve between 0 and the probability of exceedence desired, one can determine the rainfall threshold.
[edit]An example
Load the sample file SG-ROME.DAT. The file contains monthly rainfall time series data for Rome, from 1782 to 1980. Years are listed along the rows and the columns are the months. Note that each year is enclosed in quotes or the program will treat them as regular numbers and include them in the probability calculations. The order of the columns is not important, so the columns could cover July through June, and data can belong to different stations. 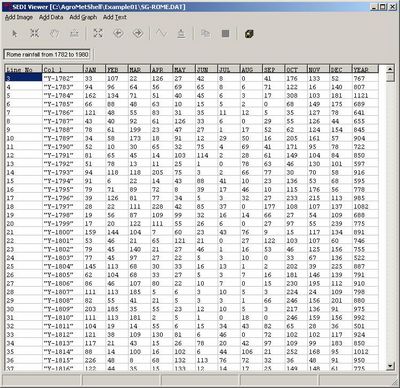
Activate the Tools - Gamma Distribution function. A settings window appears. You are prompted to enter values for the probability table. For this example, enter 0 for LOW, 200 for HIGH and 20 for STEP. 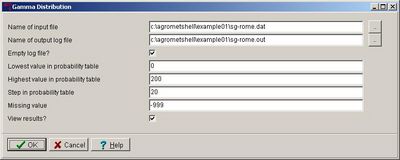
The log file contains the list of variables followed by the statistics of the gamma distribution (Gamma and Beta) together with the number of years, the number of years with no rain (number of zeros), and the long-term average. This is followed by a probability of exceedence table, listing the rainfall amounts ranging from 0 to 200 on the left-hand side followed by the probabilities. As an example it can now safely be said that January rainfall in Rome rarely exceeds 200 mm. 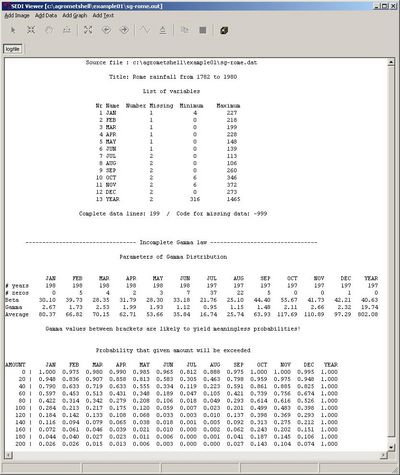

| CM Box User Guide | Main Page | About | Special pages | Log in |
Printable version | Disclaimer | Privacy policy |


