[edit]8.2. Remote Sensing and its role in crop forecasting.
Jan Jansonius, René Gommes, Peter Hoefsloot
[edit]Introduction
Satellite data are a useful source of large-area information for crop modelling. In addition to providing up-to-date rainfall estimates, they provide vegetation indices that can be used to derive Leaf Area Indices (LAI). This, in turn , may be used to assess the performance of the crop model and update predictions. Meteorological forecasts must be used where projections into the future are required. These vary in character depending upon lead time and on spatial scale. For example, forecasts up to approximately ten days can be deterministic, whereas monthly and seasonal forecasts should consider chaos theory and therefore are often expressed probabilistically.
Simulation models and satellite data are complementary. Firstly, because remote sensing can contribute to estimating surface agrometeorological variables. Secondly, satellite inputs are currently used in crop modelling. In spite of current shortcomings of the proposed methods, there is little doubt that with improving spatial and spectral resolutions, progress will be made in the area of water balance components (soil moisture) and biomass estimations (especially the above-mentioned LAI and conversion efficiencies).
Early attempts to use satellite data in crop forecasting focused mainly on Vegetation Indices (VI), i.e. satellite-derived indices that are related to living green biomass. While the qualitative use of VIs has become routine in many countries, their quantitative use in crop yield forecasting has remained disappointing, due to well understood factors. It is suggested that one of the largest potentials for VIs and other satellite inputs such as cloud information lie in their use as auxiliary variables for stratification, zoning and area averaging of point data in combination with GIS and geostatistics.
In many circumstances, particularly in many developing countries, fields tend to be small and irregular in size and shape, crops are often mixed, etc. so that the sensors measure essentially a mix of crops and natural vegetation. It is then generally assumed that crops follow greenness patterns similar to vegetation. This is a reasonable assumption in areas where vegetation shows marked seasonality, for instance in semi-arid areas. Many of the difficulties listed disappear at higher spatial resolutions. Weather radar-derived rainfall and imagery from microwave satellites are now commonly available to the operational agrometeorologist. Microwave imagery provides estimates of superficial soil moisture. Together, the two sources have the potential to improve soil moisture estimations and, therefore, forecasts as well. Some satellite derived imagery is discussed in more detail below.
[edit]Normalized Difference Vegetation Index (NDVI)
[edit]Definition
The normalized difference of the vegetation index [NDVI] is a non-linear transformation of the visible (red) and near-infrared bands of satellite information. NDVI is defined as the difference between the visible (red) and near-infrared (nir) bands, over their sum. The NDVI is an alternative measure of vegetation amount and condition. It is associated with vegetation canopy characteristics such as biomass, leaf area index and percentage of vegetation cover.
NDVI = nir - red / nir + red
The NDVI is representative of plant assimilation condition and of its photosynthetic apparatus capacity and biomass concentration. In particular vegetation index dynamics in time are correlated with the Canopy Leaf Index (LAI) and other functional variables. These variables are strongly conditioned by the behavior of precipitation, temperature and daily radiation of the observed area. Vegetation index therefore is representative of plants' photosynthetic efficiency, and it is time varying due to changes in meteorological and environmental parameters. The eruption of the volcano Pinatubo in the Philippines in June 1991 has affected NDVI values during at least two years.
[edit]Use of NDVI in crop forecasting
Notwithstanding the limitations described above, NOAA-AVHRR remote sensing data has been regularly used by many countries. The Normalized Differential Vegetation Index (NDVI) is a measurement of the greenness of the ground cover, either crops, grazing land, forest or other vegetation and is correlated with plant vigour and potential yield. It is a valuable indicator for crop conditions, especially in areas where rainfall is a major limiting factor. For example a drought sneaking up in remote parts of a country, its spreading and eventual retreat can be closely monitored by successive NDVI images with 10-daily interval.
It should be realized that a sharp reduction in NDVI values could reflect crop maturity or water stress during an earlier crop stage. Therefore, precise information on planting and harvesting period of various crops and varieties is an essential requirement. Regular inspection of field conditions for calibration of the satellite data or “ground truth” is always required.
There are several ways to relate NDVI values to crop yield. One indicator is the total of average monthly values. An other, probably better, indicator is a weighted average of NDVI values during different crop stages, where a higher weight is given to flowering and early grain filling stages. Current NDVI values should always be compared to those of several previous years for the same crop in the same area. A time series of NDVI and crop yield data is required for establishing a regression function.
NDVI is ideal for monitoring large areas from one 10-day period to the next, including remote areas where road access is difficult. In semi-desert areas where grazing conditions are studied, the onset of rains will be shown nearly immediately and by spectacular colour change on the NDVI imagery (for example the Ogaden region of Ethiopia).
NDVI has also been used, in favourable circumstances, for estimates of planted crop area and for the assessment of the area affected by flooding or other natural catastrophes.
[edit]Cold Cloud Duration imagery (CCD)
[edit]Introduction
Meteosat imagery has also been in use in many countries. The FAO ARTEMIS programme produces Cold Cloud Duration (CCD) values, which are loosely correlated with rainfall. Such techniques are normally considered as a complement rather than a substitute for traditional rainfall recording by raingauges.
Difficulties that have been associated with remote sensing techniques are the access to the data, its cost, the cost of the equipment to analyze the data and lack of trained staff..
[edit]Possible applications
Here-under a number of applications are listed.
Estimating End of Season
NDVI Application for Estimating End of Season Primary Biomass Production NDVI data can be applied to estimate primary biomass production for the rangelands. This is a calculation that more accurately estimates herbaceous biomass as opposed to woody biomass.Click here for article Estimating Start of Season
Using a series of Normalized Difference Vegetation Images (NDVI), it is possible to monitor vegetation development. Assuming that crops follow a pattern similar to natural vegetation, planting dates - also known as the "start of the season" - can be estimated.Click here for article [edit]Using satellite imagery in CM Box software
The CM Box software that is used widely for the analysis of Satellite imagery are Windisp and Agrometshell.
Windisp can be used to display and analyze the imagery itself. As an example an NDVI image for West Africa is shown. 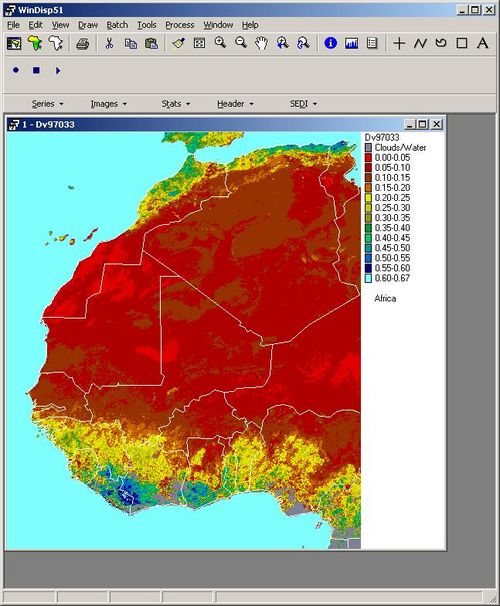
AgrometShell allows users to extract data from images into the agrometeorological database and use the imagery as background factor for interpolation (SEDI). See to the right an example of SEDI assisted interpolation. 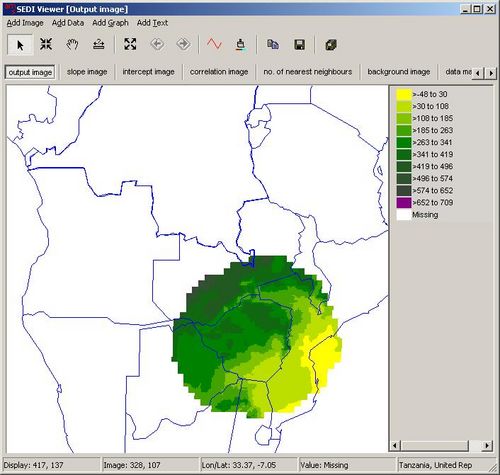

| CM Box User Guide | Main Page | About | Special pages | Log in |
Printable version | Disclaimer | Privacy policy |

