[edit]4.2. Analysis of time series of climate and crops to identify trends. Detrending yield
René Gommes, Peter Hoefsloot [edit]Analyzing yield trends
An increase in crop yield from year to year may be explained by gradual improvements in technology, while other variables such as weather conditions, pests and diseases, input availability are all fairly constant or “under control”. The factors which affect the variability of agricultural yields can roughly be grouped in three categories according to their variations over time:
- growing smoothly, such as more or less regular technology and management trends (i.e. mechanization, varieties, irrigation, and the farmers know-how), but growing more abruptly for several years in succession in the case of innovations. A typical innovation would be the new introduction of irrigation;
- discontinuous, like extreme factors of various origins and policy decisions which affect management (for instance, farmers may decide to use less fertilizer if it is no longer subsidized) or infrastructure, such as the construction of a road which provides access to new markets;
- pseudo-cyclic, like weather. The result may be a complex curve where it is often rather difficult to separate weather from other factors, particularly if weather itself is affected by a trend...
A graphical example is given below. Read an article on this subject by R. Gommes here
A theoretical example of some of the factors affecting agricultural yields (the heavy red line): technology and management trends, innovation, policy, extreme factors and weather 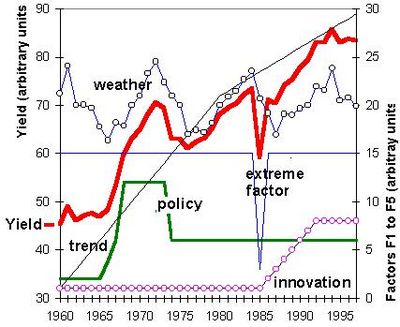 [edit]
Detrending yield
The goal of detrending is to get a good long-year record of yields that can be used to calibrate water balance model results against. Establishing a good series of yield data requires the application of some detrending statistics to get the so-called detrended yield. The hypothesis is that an upward (downward is not very likely) trend in yields caused by the factors mentioned above is eliminated from the statistics. Once that is done, a yield recorded 25 years ago will still have predictive value for the current season.
The relative detrended yield is the departure of yield values from the time-trend, assumed to take into account the technology and management component of yield. The absolute detrended yield is the projected yield of a certain season to the current season..
Detrending yield requires two steps. The first step involves the fitting of a smooth curve through the yield statistics. In a second step the actual detrended yield is calculated. An example in Excel is given below. This Excel example worksheet can be downloaded here.
Suppose the following yield statistics from 1981 to 2005 for an imaginary place. When a linear regression is applied, the slope and intercept at the bottom are calculated. This leads to a “predicted” normal yield in the third column. The exact Excel formulas can be examined in the worksheet. 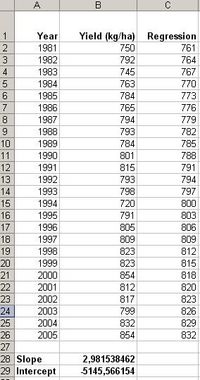
The detrended relative yield can be added by subtracting the second and third column. 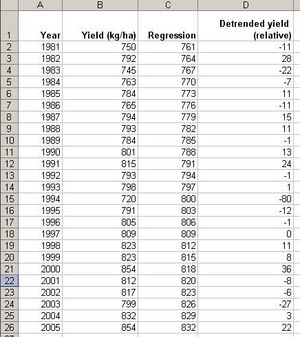
Following the regression equation a yield of 835 kg/ha is to be expected under “normal” circumstances in the year 2006. Using this figure, the absolute detrended yield (valid for the year 2006) is in the fourth column. 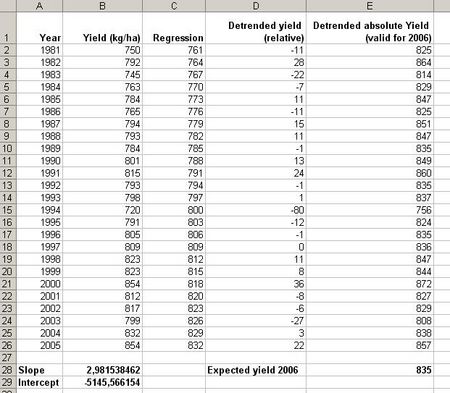
The calculations in graphical form. The yields in the yellow line can be used to calibrate the water balance output against. 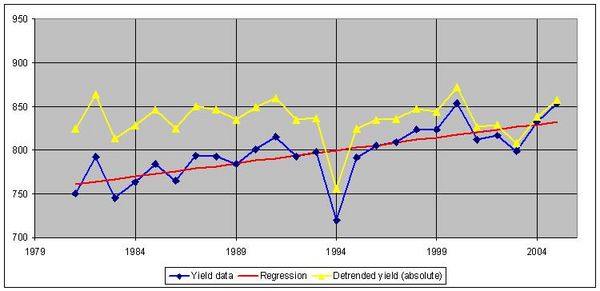

| CM Box User Guide | Main Page | About | Special pages | Log in |
Printable version | Disclaimer | Privacy policy |


