[edit]2.2. Setting up a monitoring network.
Peter Hoefsloot Before setting up a monitoring network a decision has to be made on the type of network that is appropriate for the country or region at hand (See previous chapter). This chapter outlines the practical steps to initiate a network given the choice made.
[edit]Introduction to a station-based network
Most countries have an extensive network of meteorological stations. The most important for crop forecasting are :
- Synoptic stations. These stations provide hourly data on a real-time basis. Usually these data are fed into the global GTS system of WMO. Most of these stations provide weather data that enable users to calculate the Penman-Monteith reference evaporation (ET0). A subset of these stations do upper-air observations, which is probably less interesting for agrometeorological purposes.
- Realtime Rainfall stations. These stations monitor just rainfall and send their data to the National Meteorological Office once a day.
- Off-line rainfall stations. These stations report their daily data once a month or even once a year. These stations are usable for climatic studies and the provision of normal data.
[edit]Stations to be included in the crop monitoring network
Although the station selection criteria differ from country to country a few guidelines are universal:
- The stations should be in an area where the monitoring crops are located.
- A reasonably stable stream of data on de dekadal basis (or daily, hourly basis) should reach the crop forecasting unit.
- Stations should be evenly spread in crop growing areas. It does not make sense to include five stations in a 10 by 10 kilometer area (this is often the case in a capital city).
[edit]Data requirements for a station
To monitor crops in a water balance model, the following data are needed for the selected stations:
- Rainfall (both actual and normal)
- ET0. (Potential evapotranspiration)
- Crops (which crops are planted and where they can be found)
- Planting dates for crops (PLD)
- Cycle length for all the crops (CYC)
- Water Holding Capacity (WHC) of the soil.
- Percentage Effective Rainfall (EFR)
- Pre-season Crop coefficient (usually around 0.15)
- Irrigation data including bund height (when applicable).
Many of the parameters above can be extracted from national sources and vary little from year to year. The bottom line for inclusion of a station in the crop forecasting network is the provision of good and regular rainfall data on a dekadal basis.
[edit]Station based network step 1. Entering administrative areas
Most countries are subdivided in provinces and districts although the names for the administrative units may differ. In this first step, these units are entered into AgrometShell.
Entering administrative units. Activate the menu item “Database – Manage Stations”. Press the “Administrative Levels” – button at the top of the screen. will appear. The top part enables the entry of provinces (administrative level 1), the bottom part is for the entry of administrative level 2 (districts) corresponding with the province. The country codes used can be found here: Country codes 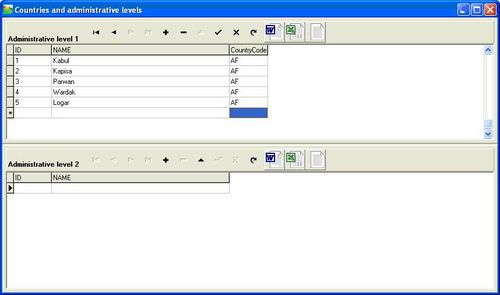 [edit]
Station based network step 2. Entering station attributes
The following attributes are needed for every station. These attributes will be entered in the CM Box software AgroMetShell:
- ID (national or international number)
- Name (spelling is sometimes an issue)
- Longitude
- Latitude
- Altitude
- Province (optional)
- District (optional)
In Agrometshell activate the “Database – Manage Station Lists” function, select <Create new list> and specify the name for the new list E.G. “crop monitoring network”. Press OK.
Entering station attributes. A window will appear in which to enter the names of the new stations and all the attributes. In the first column the code of the station is specified. The second column specifies the station name. The third column specifies the latitude, the fourth the longitude, the fifth the altitude. The next three columns enable the user to specify the country and the administrative levels from “pick lists”. After entering all the stations the screen should look like this. 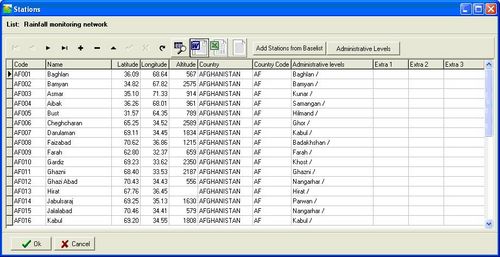 [edit]
Station based network step 3. Checking the network
Make sure that the monitoring network contains stations in all cropping areas. This can be done easiest by creating a map.
Viewing the station map. | Activate the Database-Map function. Specify "Station Name" at the second option and press <Ok>. The map station map appears. 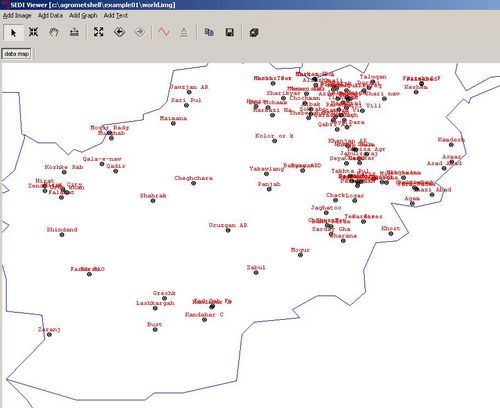 [edit]
Introduction to a grid-based network
Although a station-based network is the preferred type of network, a grid-based network is often the only possibility. Luckily, through the years the quality of satellite derived data has improved dramatically and good data is available at low or no cost at all. Organizations ECMWF (European Centre for Medium-Range Weather Forecasts), EU/JRC, FAO provide good satellite data for use by national early warning units.
In a grid-based network, the water balance calculation is done with “fake” stations. These stations are laid out in a regular network in the CM Box software. Agrometshell fully supports the use of a grid based network. The next paragraph will outline this.
[edit]Creating a grid based network.
The creation of a grid-based net work is best explained through an example. In the example below a grid for Southern Africa will be created.
Activate the Tools-Create Station List from Grid function in AgrometShell. The first step is to specify the map that defines the boundaries of the study area (usually a country or a sub-region). In this example, a grid for Southern Africa is created. The Southern Africa countries can be found in the “world.bna” boundary file included in the AgrometShell installation package. 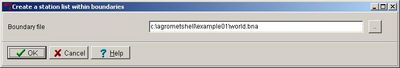
In this window the grid is defined. At first select the polygons in the top box and select them with the down-arrow. Then specify the grid density. In this case 0.,5 degrees is chosen. Press <Redraw> to see the result. The result is a grid where stations are half a degree apart. Note that the program predicts the creation of 1343 stations. Specify a list name to be generated and prefixes for the station names and ID’s in order to clearly distinguish the stations in the list from other stations in the AMS database. 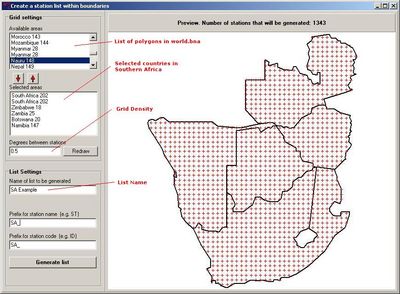
After pressing the <Generate> button, the list is filled and shown in the AgrometShell station list editor. 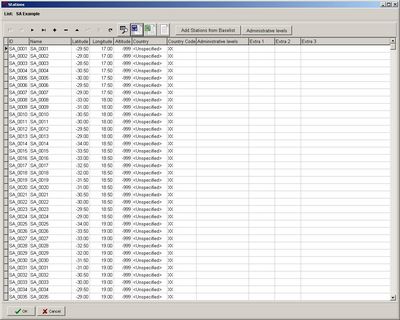

| CM Box User Guide | Main Page | About | Special pages | Log in |
Printable version | Disclaimer | Privacy policy |


